

From the dashboard, you can quickly access various features from the sidebar tabs located on the left side. These include: Dashboard, Impact Cases, Incidents, Districts, Businesses, Settings, Help, and Logout.
At the top right of the dashboard is the Create Impact Case button.
An impact case can be created straight from the dashboard by clicking on the button.
Choose An Incident To View Related Cases
![]()
Choose an Incident to view related cases selection box is located on the top of the Dashboard, Impact Cases, and Districts. The selection box is a drop down which allows users to select and review a specific incident. The selection selection options are All (default) and any Incident created. Selecting an incident will refine the system and display only the information for the specific selected incident.
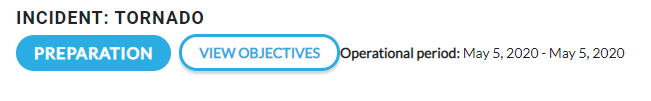
Selecting an incident will display the incident, the stage the incident is in, the view objectives button, and the operational period below the selection box.
Daily Impact Cases

Daily Impact Cases is a dashboard report which displays any new cases entered into the system for that day, with a brief comparison to the previous day.
Weekly Impact Cases
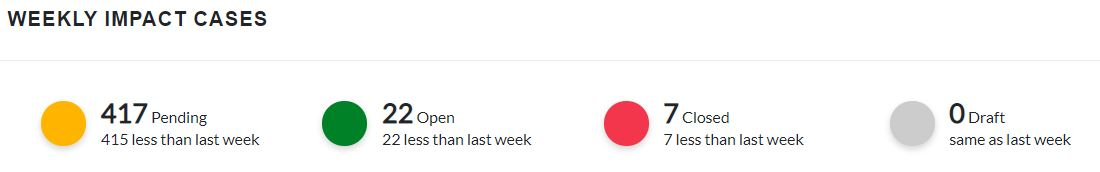
Weekly Impact Cases is a dashboard report which displays report status changes for the week.
- Pending cases are identified by the yellow dot.
- Open cases are identified by a green dot.
- Closed cases are identified by a red dot.
- Draft cases are identified by the gray dot.
Next to each status is the number of cases. Below the number of cases is the comparison to the previous week.
Current Impact Cases
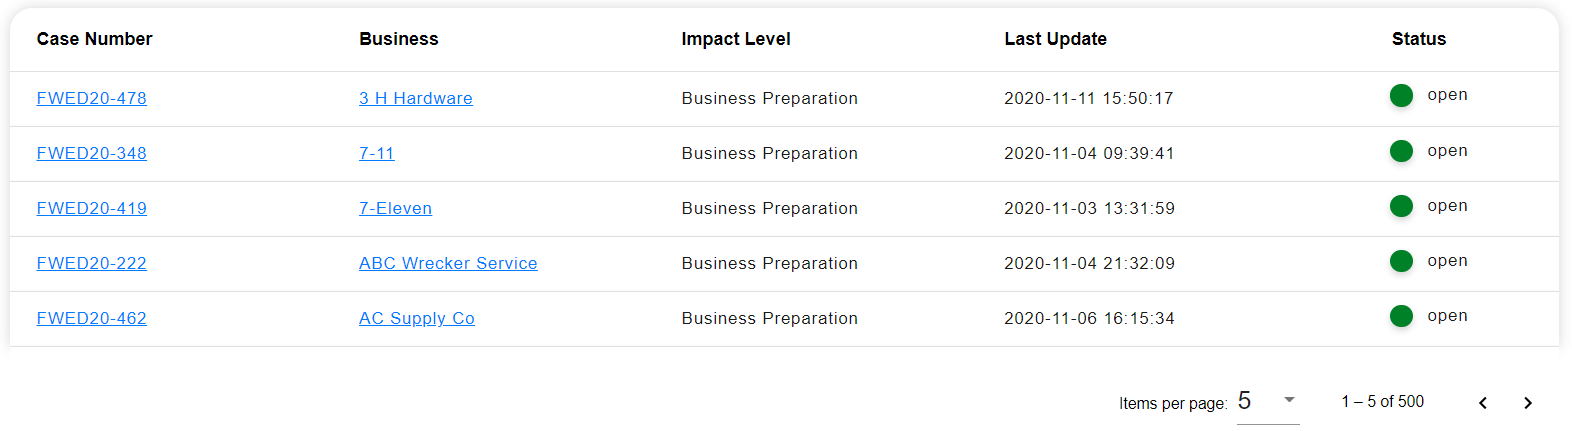
The Current Impact Cases are located below the Daily Impact Cases and Weekly Impact Cases. The list displays each case’s Case Number, Business, Impact Level, Last Update, and Status. There are several lists in the system in the column format. Lists can be sorted by clicking on the column title.
The Case Number and Business Name are hyperlinked in blue. Clicking on the Case Number displays the impact case submitted. Clicking on the Business Name displays the business’s information and the cases that business has submitted.
Below the list of impact cases is Items Per Page. The number of viewable cases can be increased or decreased by clicking and editing the number; choose from viewing 5, 20, 25, 50, or 100 at a time. This feature is available with both impact cases and businesses.
Impact Level Breakdown and Top 10 Categories

The Impact Level Breakdown displays the percentage of Open and Closed Cases associated with an Impact Level. The Top 10 Impact Categories bar graph displays the top categories. Moving the cursor over the impact level or category on the pie chart or graph will reveal the number of cases in that level or category.
Impact Ledger
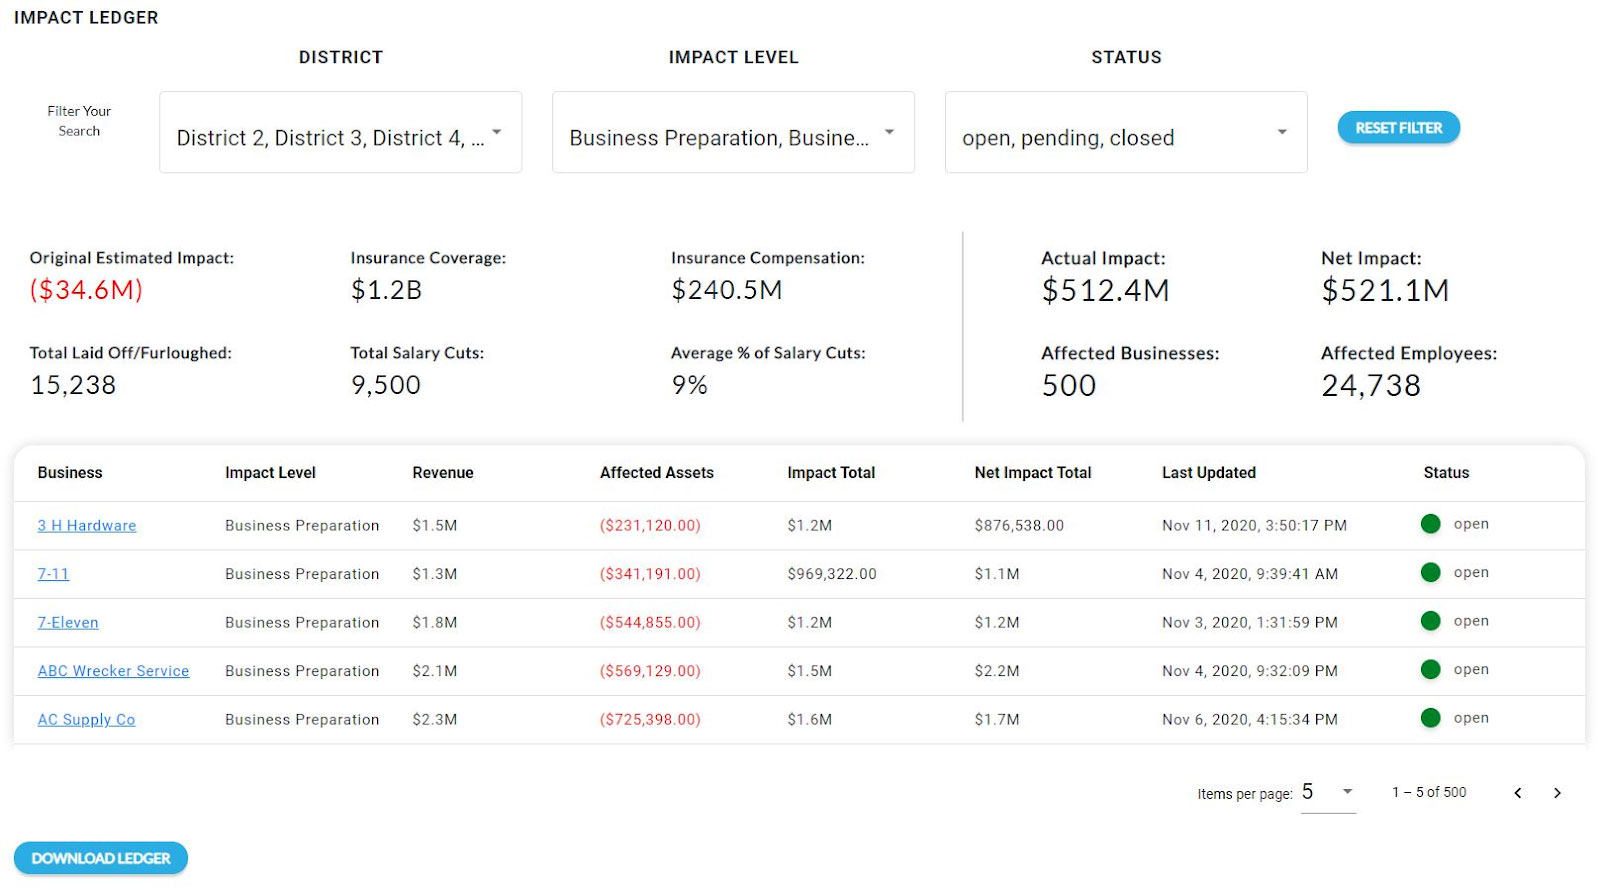
The Impact Ledger is the global ledger and calculates from the business impact case ledger. The list of businesses that have been impacted are listed below the ledger, For specifics, see Ledger.